
Happy Spring Day!
|
On the wires… |
|
|
Quote of the day |
|
“Spring is nature’s way of saying ‘Lets party’” – Robin Williams
|
|
|
|
|
|
|
|
|
|
|||||||||||||||||||||||||||||||||||||||||||||||||||||||||||||||||||
|
The indicators… |
|
|
|
|
|
|
|
|
|
|||||||||||||||||||||||||||||||||||||||||||||||||||||||||||||||||||
|
|
|
|
|
|
|
|
|
|
|
|||||||||||||||||||||||||||||||||||||||||||||||||||||||||||||||||||
|
|
Currency crackdown… |
|
|
|
|
|
|
|
||||||||||||||||||||||||||||||||||||||||||||||||||||||||||||||||||||
|
|
FXOne would like to thank Judy Padayachee from ABSA for her valued technical contribution to the currency comment this morning. *Report released 29 August *Please see attachment for other currency technical analysis The selloff in the ZAR over the last five trading days originated near its best level for multiple months/weeks against the USD, EUR, GBP, AUD and CNH (FX pairs we cover), but also near range boundaries and moving averages, which were tough hurdles to break on a consistent basis. Indeed, the ZAR bulls lost some momentum this week. As we end the month and week, we note that the ZAR is poised near the midpoint of the range boundaries, and as discussed below we highlight the key levels to watch near term. However, the main thrust of our message is that the ZAR bulls could enjoy even better levels before year end, but the moves are not likely to be as aggressive as that experienced in 2016-17 and 2020-21 but rather a consistent to-and-fro pattern as has been the case since mid-2023. As for EURUSD, although the long-term uptrend has entered the 1.1600-1.2600 resistance area, the EUR bulls could have the legs to extend into year end. Indeed, the uptrend is well underpinned near 1.1000 (Previous support and 200-day moving average) and we cannot rule out a push above 1.2000 into next quarter. Similarly, for GBPUSD, notwithstanding the recent profit taking near 1.3600 (previous resistance), while underpinned near 1.3000-1.3100 (200-day moving average and previous turnaround level) the YTD uptrend in the GBP is not likely to be damaged, and the 1.3900 level could be reached by year end.
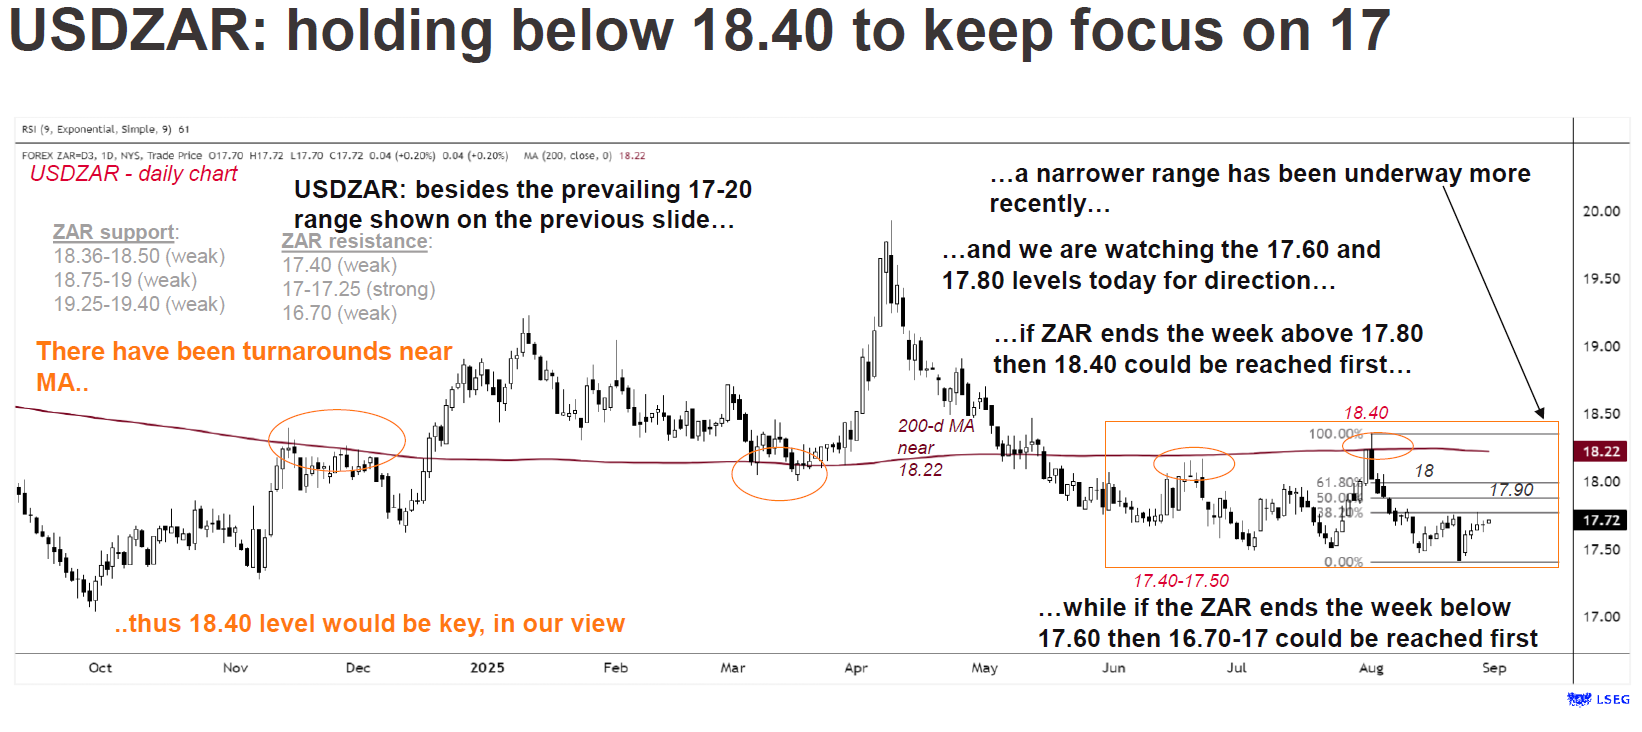
USDZAR: last week, the ZAR reached its best level YTD (near 17.40) but struggled to maintain that momentum this week. Indeed, given the turnaround on Monday we are watching the 17.60 and 17.80 levels today for near term direction. If the ZAR ends the week above 17.80 then the 18.40 level could be reached first, to maintain the 17.40-18.40 range, which has defined the price action since June 2025. However, if the ZAR ends the week below 17.60 then the 17 level could be reached first. Our bias is that the 16.70-17 area could be reached first before the 19 level. Indeed, a wider range trade (17-20) has defined the moves since Q2 23, and we cannot rule out a more aggressive extension towards 16.70 on the bullish-ZAR leg and 19-19.50 on the bearish leg to maintain this wide range trade over the next six months.
EURZAR: similarly, the ZAR posted its best levels in 11 weeks against the EUR (near 20.35) last week but failed to carry that momentum into this week. With the turnaround taking the ZAR back towards the trendline near 20.80, we have two key levels we are watching for direction going into next week. Ultimately, with the EUR building an uptrend against the USD, the ZAR has struggled to post a YTD best level against the EUR recently, unlike against the USD. The risks are that EURZAR could reach 20.80-21 first before another attempt to reach the 19.85-20 area (psychologically important level, 200-day moving average and previous turnaround levels). Bigger picture, we believe that both the 20 and 21.50 levels could be reached over the next four-six months, but ultimately, the EUR remains in a long-term uptrend for an eventual move above 21.50 long term.
GBPZAR: the ZAR did better against the GBP that against the EUR last week with GBPZAR dipping below 23.55. However, the ZAR similarly battled to maintain the bullish momentum this week and traded slightly above 23.90 at the latter end of the week. If the ZAR ends the week above 23.90 then the risks are that the 24.15-24.25 area (range boundaries) could be reached first. While if the ZAR ends the week below 23.90 then our call for another attempt to reach 23-23.30 before year end has been reinvigorated. Bigger picture, the pair has been trading in an even wider range of 22.35-25.47 since Q2 23, and which keeps us looking for a leg towards 23.Ultimately, we believe that the next couple of months could be defined by to-and-fro legs, both to 23 and 24.25.
AUDZAR: the AUD enjoyed some gains against the USD this week. Given the about-turn ahead of the range low and 200-day moving average near the 0.6350-0.6380 area, the focus has shifted to the high of the 14-week range near 0.6625 near term. As such, the range-trade has been reinforced near term. However, for the longer term, while underpinned near the 0.6000-0.6350 area the risks are that the AUD bulls have an edge, which could see the 0.6700 level surpassed before year end. In the case of AUDZAR, the ZAR sold off aggressively and is back above 11.42 warning that our call for a push to the 11.63-11.64 area (200-day moving average) near term could be underway. Ultimately, a larger range trade (11.24-12.20) has been underway since December 2024, and given that the about-turn near 11.28, we cannot rule out an extension towards 11.82 over the next two weeks. Thereafter, we would look for another attempt to reach 11.20. However, we note a potential trendline (from 2018) and ascending triangle (from 2016), which could provide a major support for the AUD bulls near the 11-11.10 area, and could be a tough hurdle for the ZAR bulls to overcome.
CNHZAR: the CNH dipped below the 7.14-7.23 range, which was in place for 15 weeks, yesterday. Our call has been for the CNH bulls to outpace the USD into quarter end. Although we note that the USD is extremely oversold on the daily charts, in the absence of an aggressive break back above 7.14, the risks are that the 7-7.05 area could be reached first before the USD bulls get some reprieve. As for CNHZAR, the ZAR struggled to stay below the 2.43 level this week has been under pressure for the last four days, with moves back to 2.48. As such, the 2.43-2.55 range remains largely in place for the 15th consecutive week. Given that the pair is poised to end the month above the multi-year trendline near 2.43, the risks are that the CNH bulls could have the upper hand with a push towards the 2.53-2.55 area before another attempt at the 2.41 level. That said, CNHZAR has been trading in a wider range of 2.41-2.70 since Q3 23, reinforcing that the 2.40-2.41 area (major trendline from 2018 and ascending triangle pattern) could be a tough hurdle for the ZAR bulls to break aggressively and on a sustainable basis. As such, we cannot rule out another attempt to reach the 2.58-2.60 area towards late-H2 25/early-Q1 26 to maintain a long-term uptrend in the CNH.
Disclaimer: This communication (“this communication”) has been provided by the corporate and investment banking division of Absa Bank Limited a registered bank in the Republic of South Africa, a subsidiary of Absa Group Limited, with company registration number: 1986/004794/06 and with its registered office at: Absa Towers East, 3rd Floor, 170 Main Street, Absa Towers West, 15 Troye Street, Johannesburg 2001, Republic of South Africa (“Absa”). Absa is regulated by the South African Reserve Bank and is a registered financial services and credit provider. Absa has provided this communication for information purposes only and you must not regard this as a prospectus for any security or financial product or transaction. This communication is from an Absa Sales and/or Trading desk and is not a product of the Absa Research department. This communication has not been produced, reviewed or approved by the Absa Research Department, and is not subject to any prohibition on dealing ahead of the dissemination of research. The views in this communication are not a personal recommendation and do not take into account whether any product or transaction is suitable for any particular investor. This message is subject to the provisions at: http://www.absa.co.za/disclaimer. This communication is confidential and no part of it may be reproduced, distributed or transmitted without the prior written permission of Absa. By messaging with Absa, you agree to the provisions of this disclaimer. |
|
|
|
|
|||||||||||||||||||||||||||||||||||||||||||||||||||||||||||||||||||||||
|
On the radar… |
|
|
|
|
|
|
|
|
|
|||||||||||||||||||||||||||||||||||||||||||||||||||||||||||||||||||
|
|
|
|
|
|
|
|
|
||||||||||||||||||||||||||||||||||||||||||||||||||||||||||||||||||||
|
Did you know? |
|
|
|
|
|
|
|
|
|
|||||||||||||||||||||||||||||||||||||||||||||||||||||||||||||||||||
|
|
||||||||||||||||||||||||||||||||||||||||||||||||||||||||||||||||||||||||||||
According to a Facebook study, couples are most likely to break up in Spring and two weeks before Christmas. The lowest break up time is Christmas Day.
Have a super day,
Wayne Rosenberg
