
All markets are all over the place
Continue readingDaily Dose: 24 March 2026
One would think that Trump has never been guilty of an untruth the way the market reacted to the initial “Iran talks” headline
Continue readingDaily Dose: 23 March 2026
The selloff in the gold price has taken place near the 6,000 level, and the next cluster of support could be near 3,900-4,000 (psychologically-important level, trendlines, and 200-day and 52-week moving averages), where we would be looking for bottoming potential
Continue readingDaily Dose: 20 March 2026
The end of what has been a long and schizophrenic week, is upon us and I think there isn’t a single person unhappy to see the back of it
Continue readingDaily Dose: 19 March 2026
The rand came under significant pressure during yesterday’s session, weakening sharply as geopolitical tensions drove a flight to safety
Continue readingDaily Dose: 02 March 2026
Good morning,
On the wires… |
|
Quote of the day |
“Don’t watch the clock; do what it does. Keep going.” — Sam Levenson |
|
|
|
|
|
|
|
|
|
|
|
|
|
|
|
| ||||||||||||||||||||||||||||||||||||||||||||||||||||||||||||||||||||||||||
The indicators |
|
|
|
|
|
|
|
|
|
|
|
|
|
|
|
| ||||||||||||||||||||||||||||||||||||||||||||||||||||||||||||||||||||||||||
|
|
|
|
|
|
|
|
|
|
|
|
|
|
|
|
| ||||||||||||||||||||||||||||||||||||||||||||||||||||||||||||||||||||||||||
| Currency crackdown… |
|
|
|
|
|
|
|
|
|
|
| ||||||||||||||||||||||||||||||||||||||||||||||||||||||||||||||||||||||||||||||
| FXOne would like to thank Judy Padayachee from ABSA for her valued contribution to the currency comment today.
The information below is a product of Sales and Trading and does not constitute research.
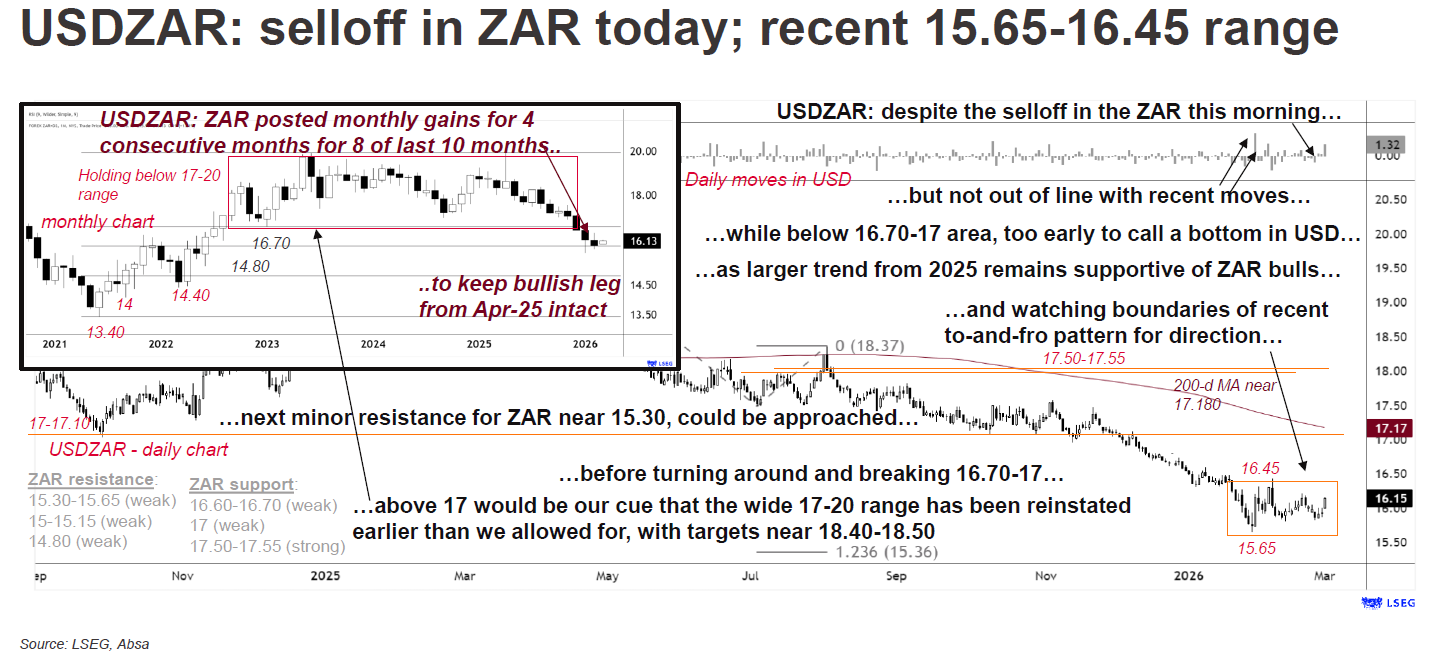
Although the ZAR is under pressure this morning, one day does not make a new trend, and we are focusing on the larger trends underway. Indeed, in the case of GBPZAR and EURZAR, the ZAR has posted monthly gains for eight consecutive months, a record against the GBP and a feat last accomplished in 2009 against the EUR. As such, the larger trends continue to favour the ZAR this quarter, in our view. As for USDZAR, the EUR and GBP have lost some ground against the USD this morning, and the ZAR has not escaped. The selloff in the ZAR (against the USD) is not out of line with the moves seen over the last five weeks. Indeed, the ZAR has been held captive between 15.65 and 16.45 over the last five weeks, and a selloff in the ZAR is seen as another leg within this to-and-fro pattern. While holding below the 16.70-17 area, our stance is that the 15.30-15.50 area could be tested near term. Thereafter, we would look for signs of turnaround potential. That said, a push above the 16.70-17 area would be cue that we are wrong to look for a dip to the 15.30-15.50 area first. Indeed, a sustained push above the 17 handle would signal that the wide 17-20 range trade from Q2 23 has been reinstated, earlier than we allowed for, and that the ZAR bull trend has been completed to shift the focus to the 18.50 level in H2 26.
EURZAR: for EURUSD, the EUR bulls have lost some traction recently and our call for a leg higher in the EUR is under duress. Our call is for a test of the 1.2100-1.2200 area over the next three-four months (changed from later this quarter), but a drop below 1.1760 would signal that we are wrong and that 1.1570 could be tested next (YTD low). Ultimately, the pair has been trading in a wide range of 0.9530-1.2555 since 2015, and a sustained breach of 1.1570 could signal that the upward leg has been completed earlier than we allowed for. Such a breach could open up targets near 1.1000 later in H2 26. In the case of EURZAR, despite the selloff in the ZAR this morning, we note that the ZAR experienced similar moves over the last two months without damaging the larger bull trend in the ZAR. Indeed, the ZAR has posted monthly gains for eight consecutive months, a feat last seen in 2009, to maintain the ZAR-bull trend initiated in April 2025. Our call is for a drop to 18.45 this quarter. However, if the pair ends the week above the 19 handle then the risks are that the 19.35-19.65 area could be tested first. Bigger picture, while holding above the 18 handle (near previous turnaround levels, potential trendline and psychologically-important level) the uptrend in the EUR could resume later in H1 26. However, a sustained push above 19.65 would be our cue that the EUR has completed a base, earlier than we allowed for, and that the ZAR bull trend has reversed, with potential targets near the 20.50-20.75 area later in 2026.
GBPZAR: for GBPUSD, after stalling near the 200-day moving average (currently near 1.3445) for the previous seven trading days, we note the dip below it this morning. However, we believe that it’s too early to call a top in the GBP. Given that the pair has been trading in a wide 1.3000-1.4250 trading range since 2016, and while holding near 1.3445 we believe that the current upward leg (initiated in 2022) could be reinstated to reach the 1.4000 later in H1 26. However, a sustained move below the moving average could signal that the 1.3000 level could be reached first before an attempt to reach 1.4000. As for GBPZAR, the ZAR has posted monthly gains (measured from close to close) for the last eight months, a record based on data from 1974. Indeed, the ZAR reached its best levels since February 2003 this and has gained some 100ZAc YTD. On this bullish underpinning we believe that the 21-21.20 level could be reached this quarter. Thereafter, next support for the GBP could be found in the 20.50-20.25 area, and we are looking for a bottom in the GBP ahead of this zone. However, a sustained push above 22.40 would be our cue that the bullish-ZAR leg (April 2025 to current) could be under pressure, and that the 24 level could be reached first, instead of 21-21.20. Bigger picture, we note some major trends in the ZAR which supersedes the current minor bull trend in the ZAR. Firstly, between 2023 and 2025 the pair was held captive between 22.20 and 25.50, and secondly, from 2017 to currently a long-term ZAR bear trend remains intact. Given this scenario, a move above 22.40 would reinstate the 22.20-25.50 range trade with long-term targets near 25.50. While a push above 25.50 would indicate a more aggressive selloff in the ZAR, and a resumption of the major bear trend in the ZAR instead.
AUDZAR: for AUDUSD, the AUD bulls have enjoyed gains for six consecutive weeks and four consecutive months, and the 0.7200 level is under threat with potential targets near the 0.7300-0.7600 area (retracement level and high from February 2021). Bigger picture, the price action has been confined to a wide range of 0.5900-0.7200 since August 2022, and a sustained move above 0.7200 could extend the gains into quarter end. Thereafter, we would look for topping potential in the AUD. That said, we note that weekly and monthly momentum are poised near turnaround levels, and the risks are that the USD bulls could make a comeback over the next two months. However, if the pair ends the week below the 0.7000 level then we are wrong, and the 0.6600 level could be reached sooner than we allowed for. In the case of AUDZAR, the pair has been holding steady near the 200-day and 52-week moving averages for last three weeks. Although we note the previous turnarounds near the moving averages (July and September 2025), a sustained break below 11.20 is needed if the ZAR bulls are going to take charge. Our stance has been that the 11.20 level could be tested this quarter to target the 10.85-11 area over the next two months. However, a decisive push above 11.38-11.44 would be our cue that we are wrong, and that the bull trend in the ZAR has reversed, and that the 11.60-11.80 area could be tested next, to target the 12 handle in 2026.
CNHZAR: although the CNH lost some ground against the USD on Friday, it remains near its best levels from H1 23. Indeed, the CNH bulls have seen five consecutive months of gains to keep the bull trend from April 2025 intact. While holding below the 6.93-6.97 area, we believe that the 6.70-6.85 area (key level from January 2023, and Fibo level and 50% retracement level for the move from March 2022 to April 2025) could be reached first. Thereafter, we would look for turnaround signals to target 7.20. Ultimately, the pair has been trading in a wide to-and-fro pattern (6.70-7.45) since January 2023, and we expect that further to-and-fro action could be experienced this year, and both the 6.70 and 7.20 levels could be reached in 2026. However, a break above 6.97 would be our cue that we are wrong, and 7.20, and higher could be reached first. As for CNHZAR, although the ZAR has lost some ground against the CNH over the last five weeks and posted a monthly stalemate pattern, we believe that it is too early to call for a reversal of the ZAR-bull trend initiated in April 2025 (near 2.70). Our stance is that while holding below 2.40 the pair could reach the 2.18-2.20 area (previous turnaround levels and retracement levels) first. That said, we note that support for the CNH is lining up near the 2.10 level and near the 1.80-2 area, and we would be looking for bottoming signals ahead of this level/area. As such, we are watching the price action into quarter end as a decisive push above 2.40 would be our cue that we are wrong, and signal that the CNH has bottomed earlier than we allowed for, and that the 2.47-2.50 area could be reached in H1 26 instead of H2 26. Note: for additional commentary and levels see the attached file. Source of all charts: LSEG, Absa
Disclaimer: This communication (“this communication”) has been provided by the corporate and investment banking division of Absa Bank Limited a registered bank in the Republic of South Africa, a subsidiary of Absa Group Limited, with company registration number: 1986/004794/06 and with its registered office at: Absa Towers East, 3rd Floor, 170 Main Street, Absa Towers West, 15 Troye Street, Johannesburg 2001, Republic of South Africa (“Absa”). Absa is regulated by the South African Reserve Bank and is a registered financial services and credit provider. Absa has provided this communication for information purposes only and you must not regard this as a prospectus for any security or financial product or transaction. This communication is from an Absa Sales and/or Trading desk and is not a product of the Absa Research department. This communication has not been produced, reviewed or approved by the Absa Research Department, and is not subject to any prohibition on dealing ahead of the dissemination of research. The views in this communication are not a personal recommendation and do not take into account whether any product or transaction is suitable for any particular investor. This message is subject to the provisions at: http://www.absa.co.za/disclaimer. This communication is confidential and no part of it may be reproduced, distributed or transmitted without the prior written permission of Absa. By messaging with Absa you agree to the provisions of this disclaimer.
|
|
|
|
|
|
|
| ||||||||||||||||||||||||||||||||||||||||||||||||||||||||||||||||||||||||||||||||||
On the radar… |
|
|
|
|
|
|
|
|
|
|
|
|
|
|
|
| ||||||||||||||||||||||||||||||||||||||||||||||||||||||||||||||||||||||||||
|
|
|
|
|
|
|
|
|
|
|
|
|
|
|
| |||||||||||||||||||||||||||||||||||||||||||||||||||||||||||||||||||||||||||
Did you know? |
|
|
|
|
|
|
|
|
|
|
|
|
|
|
|
| ||||||||||||||||||||||||||||||||||||||||||||||||||||||||||||||||||||||||||
| ||||||||||||||||||||||||||||||||||||||||||||||||||||||||||||||||||||||||||||||||||||||||||
Nauru is the only country in the world without an official capital city; it’s a small island in the Pacific Ocean.
Regards,
Nikita Govender |
Daily Dose: 02 February 2026
The elevator finally fell hard with a just about everyone on board, including this writer
Continue readingDaily Dose: 16 January 2026
We lacked any major excitement yesterday, with not a lot of action on the local front
Continue readingDaily Dose: 01 December 2025
On Friday, the rand made some ground against the $ which had softened during the Thanksgiving holiday
Continue readingDaily Dose: 3 November 2025
USDZAR: USDZAR turned up near the range lows (near 17.07) last week as the USD bulls returned with EURUSD dipping below 1.1540 (previous lows)
Continue reading